In general, the failure of components in engineering structures and the structures themselves can mostly be traced back to surface cracks. Particularly in the case of thin-walled components, the failure of the ligament leading to the wall breakthrough is the main cause of the failure of the structure. The critical cross-section is effectively weakened by the presence of the surface crack, despite its small dimensions, and therefore decisive for the failure. The investigation of the relationships in the evaluation of the limit load to a structure with the surface crack is therefore an important task in the context of the reliable prediction of fracture.
Determination of residual strength of components with surface cracks
-
In 1976, based on the so-called strip yield model, which is built up starting from the endless plate with the through-crack, the R6 method has been introduced (also known as FAD = Failure Assessment Diagram). It was assigned by SINTAP (Structural Integrity Assessment Procedures for European industry) also in the case of structures with the surface cracks. Unfortunately, there is no theoretical or empirical evidence for the validity of this solution for surface cracks. Numerous experimental results proved the significant differences in the behavior of the specimens with the surface and through crack, which is why even a separate standard was set up in the USA for the determination of KIe (ASTM-E-740).
-
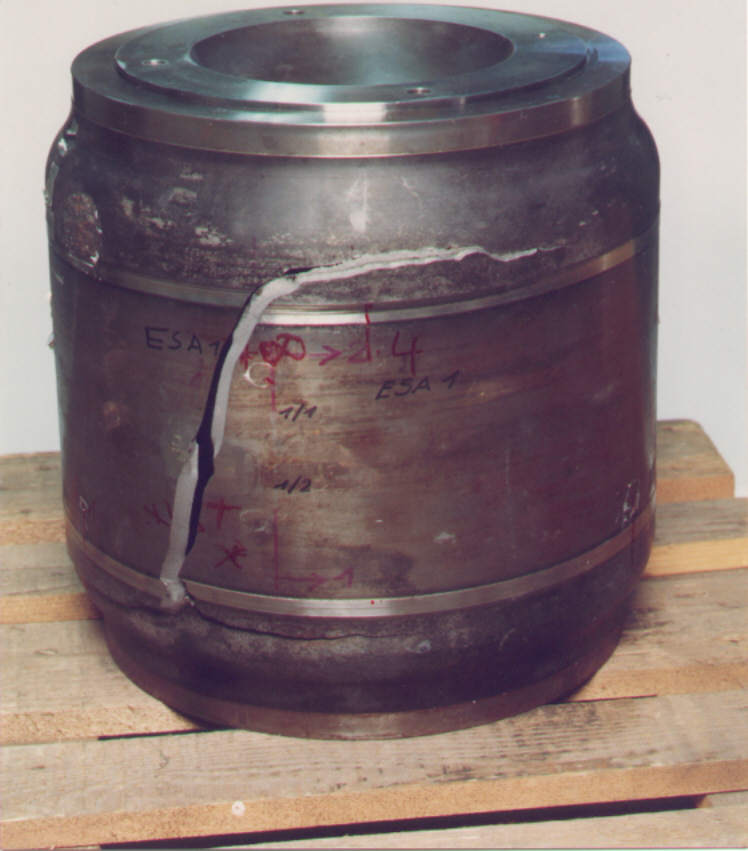
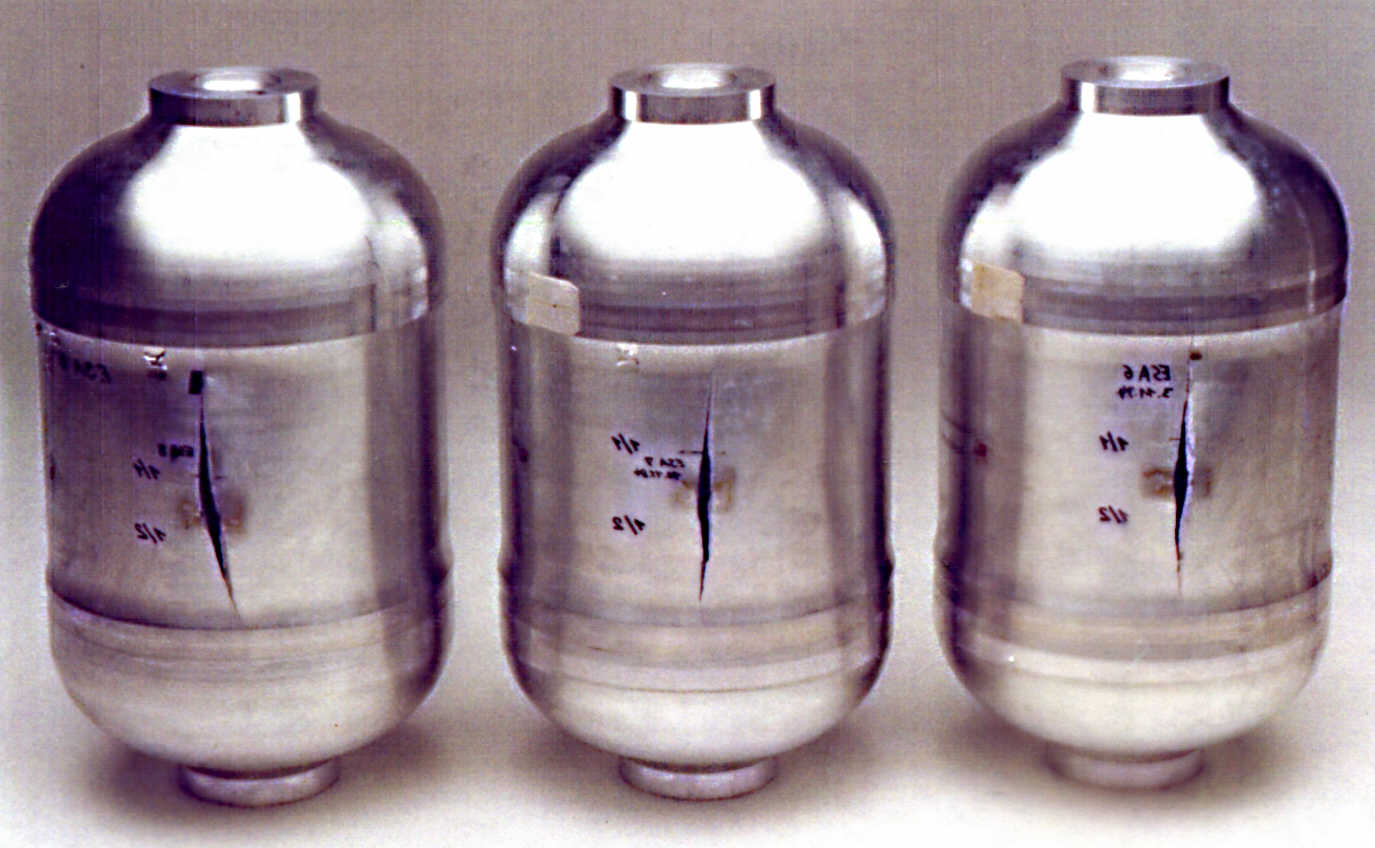
Likewise, our experimental results, within the framework of the projects financed by ESA (European Space Agency), have shown a significant difference in the behaviour of the test specimens with through and surface cracks. For the treatment of surface cracks a new procedure was therefore developed and successfully used in the design of the Solid Rocket Booster for the most reliable carrier rocket in the world - ARIANE 5.
-
Here is in particular complicated that the stress intensity as well the strain constraint along the contour of the surface cracks is not uniform, where these unevenness even further increases under elasto-plastic loading conditions through the different local yield conditions. Since the local crack opening in dependence on stress intensity cannot full fee develop, the overall failure may get about only after the stress intensity redistribution. That is why the whole failure is necessarily dependent of the energy of the total area of the crack,. i.e. the area of the crack and not by one of local values. Because the deformation and failure are controlled by the energy in cross section, for a suitable component evaluation, the consideration of two parameters that are under general conditions representative of the stored energy - stress and strain (Including plastic deformation) in the critical net section with the crack - is necessary.
-
Starting form of a surface crack may be arbitrary, but under the fatigue loading after a certain number of cycles the crack takes the elliptical contour. For this reason, all known analytical solutions for surface crack are based on the contour of the ellipse with the characteristic parameters a and c.
-
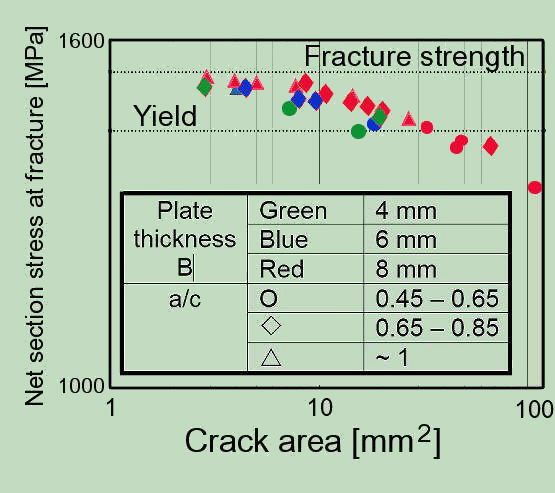
In our experiments, we found that the presentation of results based on the individual parameters of the ellipse and the ratio (a/c) lead to the large scatter. This can be practically fully eliminated (except of plate thickness influence), if the surfaces of the crack are assumed to be decisive parameter.
-
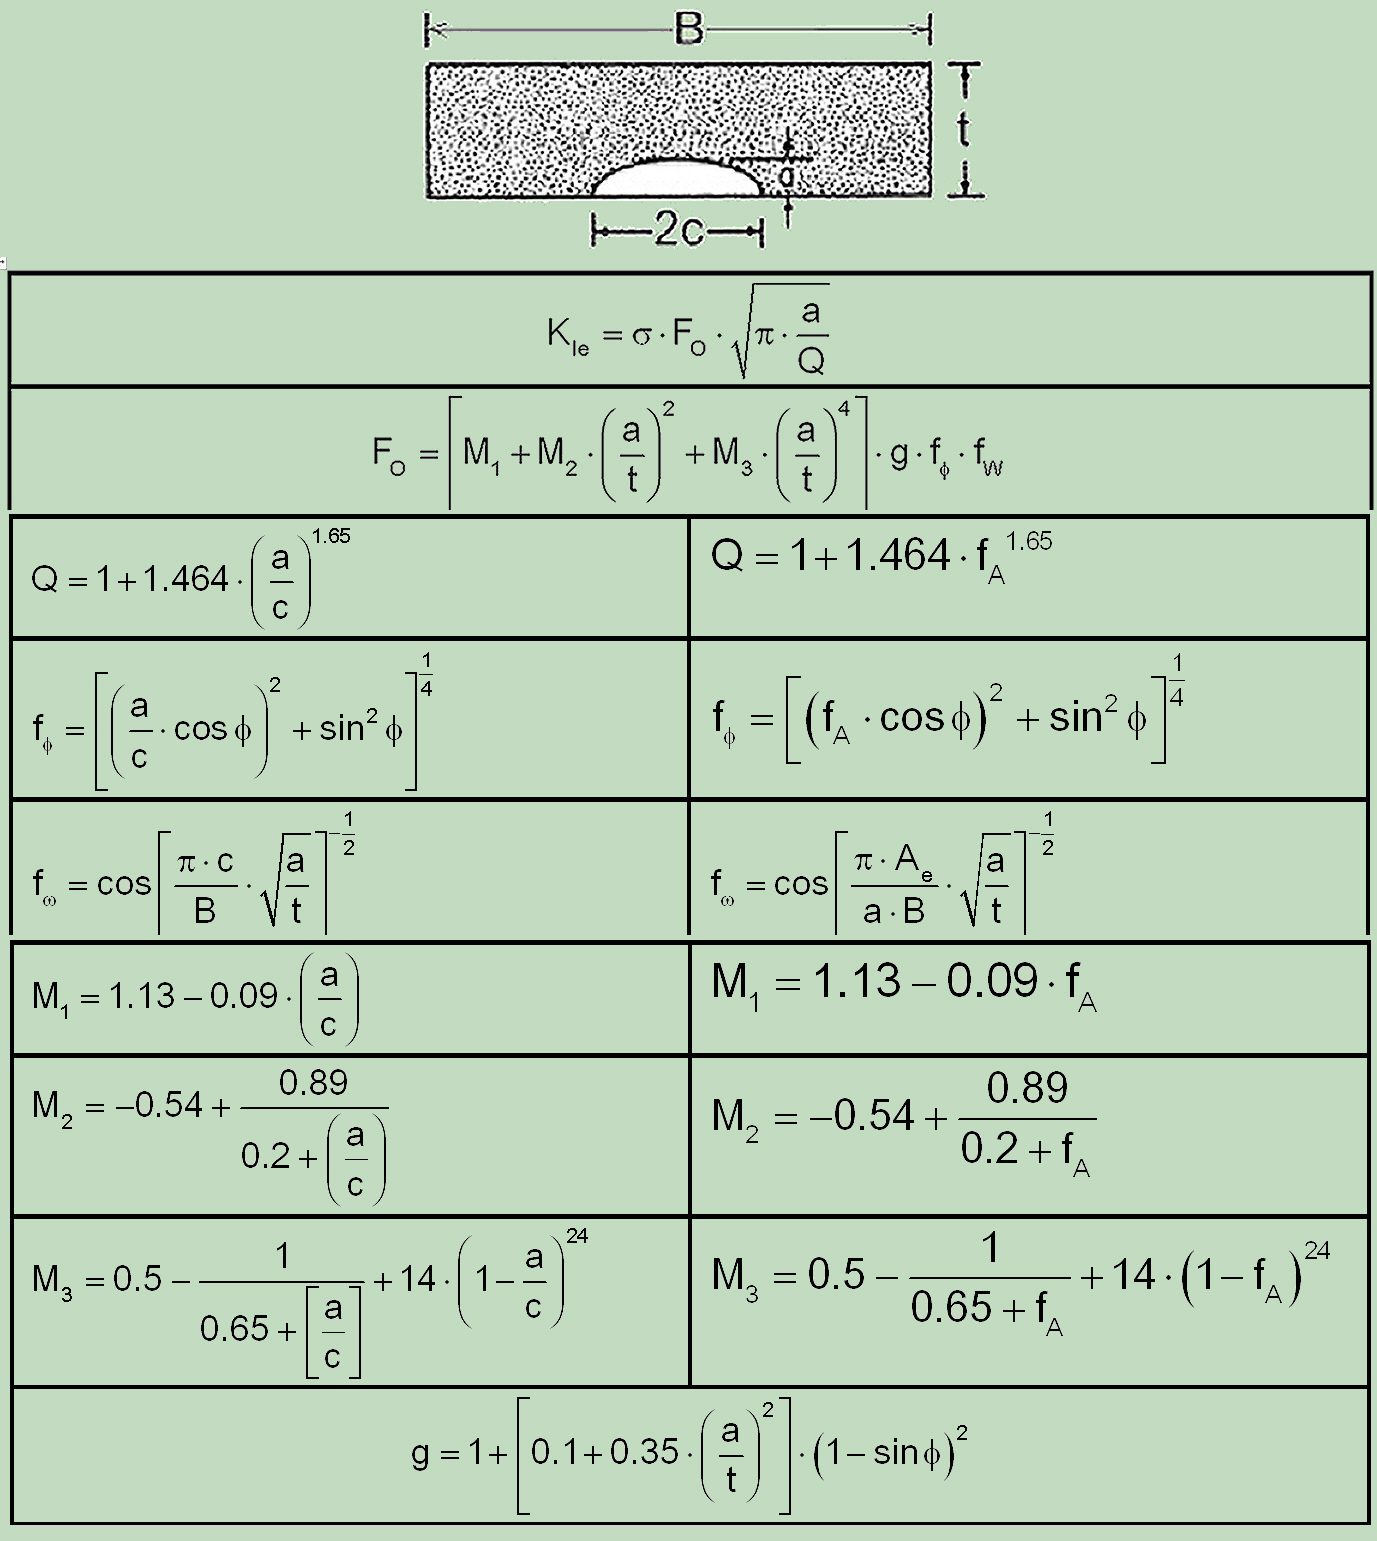
To account for this dependence, we do not need new analytical solutions, since the conversion of the existing solutions is very simple. That will be shown based on the example of the most widely used solution for surface crack in: STRESS INTENSITY FACTOR EQUATIONS FOR CRACKS IN THREE-DIMENSIONAL FINITE BODIES TO TENSION AND BENDING LOADS Subjected, by JC Newman, Jr. and IS Raju (NASA Technical Memorandum 85793, May 1984).
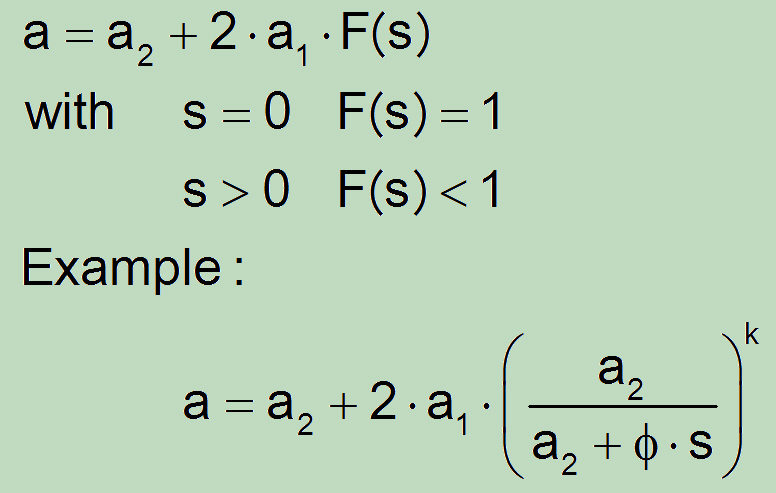
Starting from
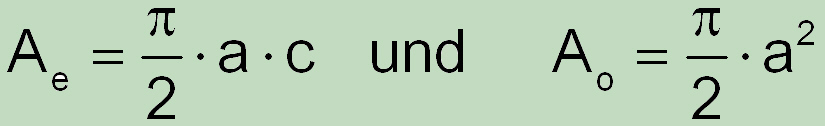
we can write
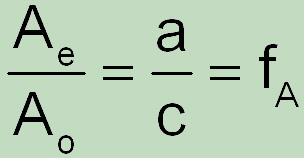
Factor fA we want, more commonly, as "area factor" designate (and not as a form factor of the ellipse). It follows below:
-
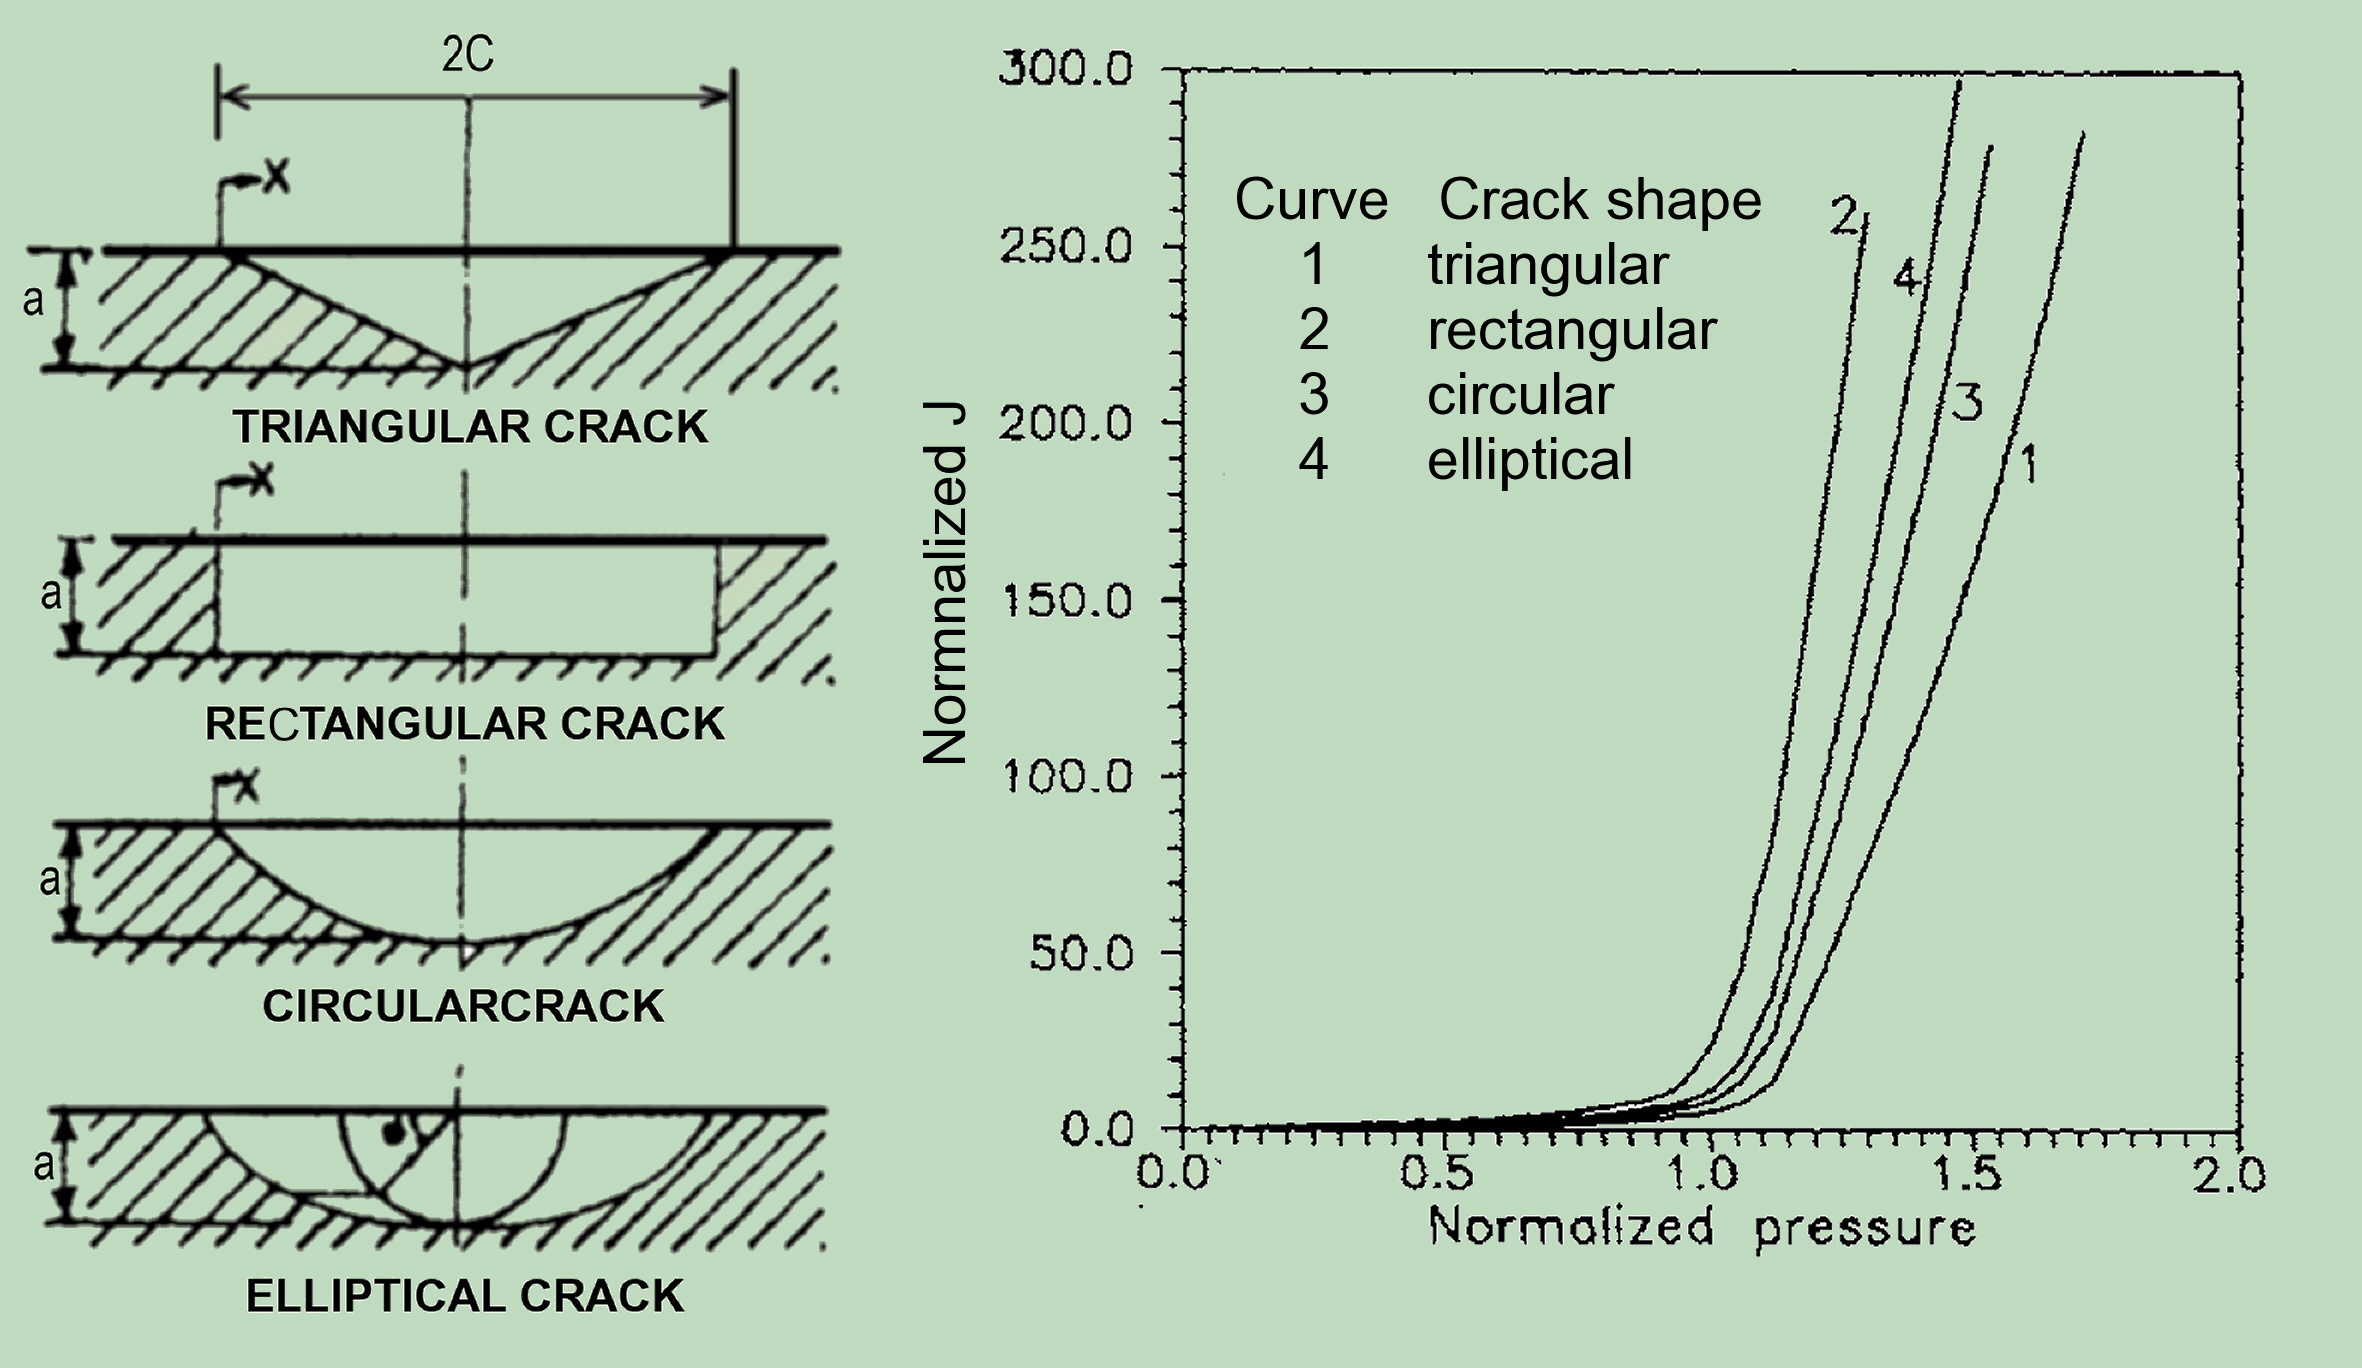
Unfortunately, to what extent the various deviations from the ideal elliptical form, which, even though typical for the practice, are usually ignored, could be investigated in this way could not be examined. However, the studies of Chavla, DS at all in "The Shape influence on the behaviour of surface crack" Smirt 13, 1995 show in this regard an unique trend in dependency of crack surface and shape.
-
The crack driving potential is, in agreement with the crack surface, for rectangular crack maximal and for triangular crack at minimum. At the same time, for triangular crack the peak driving potential does not occur in maximal depth, but slightly away from this place. So, this kind of crack hows the tendency under fatigue crack extension to translate into the oval shape.
-
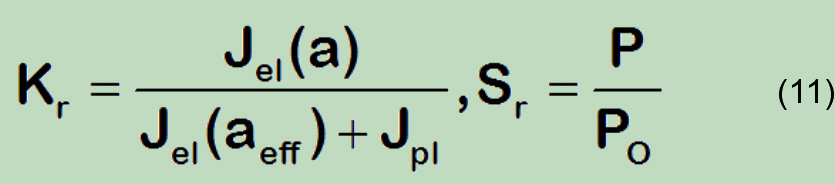
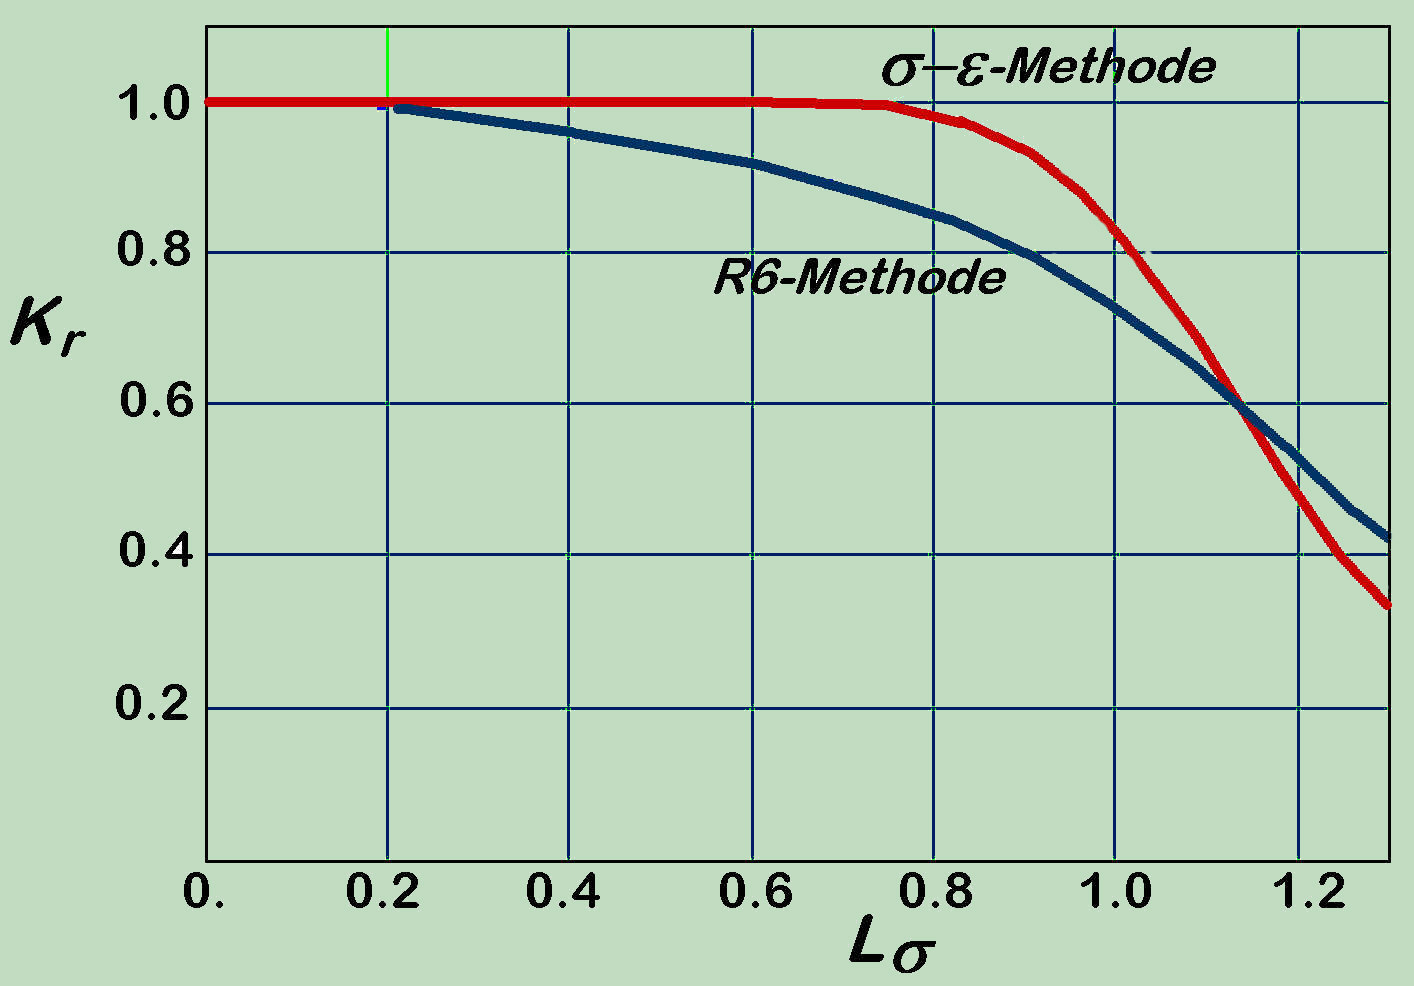
The change in the residual strength of cracked structures due to the increasing plastic deformation is shown in the so-called Failure Assessment diagram (FAD), which is established on the basis of two parameters:
- More generally, the failure envelope, based on J-integral solution is defined in the following way:
Characterizing parameters of the crack size
Presentation of the new method and proof of its advantages
Kr.....The proportion of the reduced linear elastic critical stress intensity factor, KI to the material fracture toughness, Kmat
Lr.....The proportion of the applied stress to the stress at which the yielding strength of the material is exceeded, i. e. the plastic strains in the critical section achieve significant values.
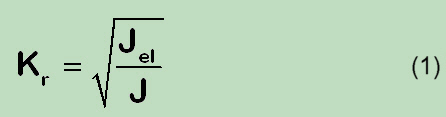
while based on the known LEFM relationship for the J-integral
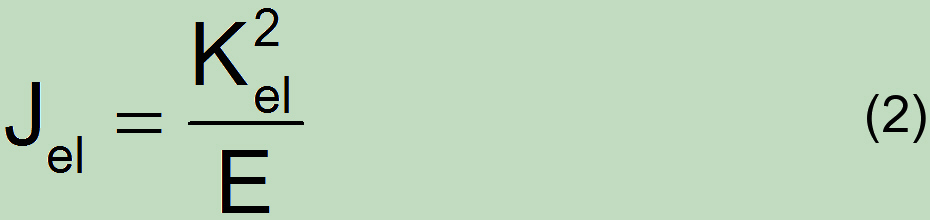
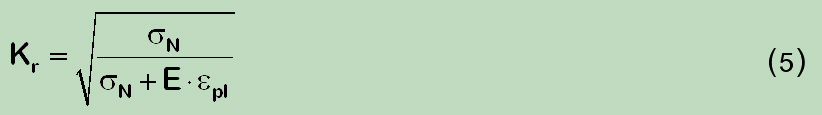
applies, it is natural to extend the same relationship for the elasto-plastic range (based on the notch approximate relationship to Neuber)
or simple:
![]()
By this extension a robust solution is gained that can be used in all regions between "elastic" and "plastic". The validity of this extension has been examined by several FEM calculationsand confirmed without exception.
Constitutive laws based on classical plasticity generally define total strain as the sum of its elastic and inelastic components, with independent constitutive relationships describing each. Therefore, the J-integral is also written as a sum of two contributions:
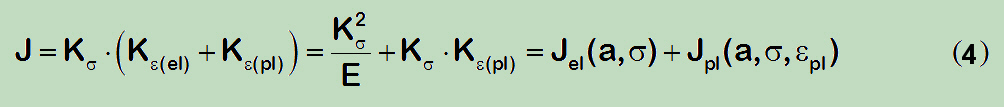
As to determine, the elastic component of the J-integral here does not consider the Irwin's plasticity correction. In fact, this correction distorts the relationships and is consequently not recommended. As is well known ductile materials are capable (due to the plasticity) to reduce (stress redistribution, blunting) the effects of the crack (or notch), while the Irwin's plastic-zone correction is doing exactly in the opposite direction (increasing actual crack size and because of this more elevated stress intensity factor level). For ductile materials, this correction in terms of an increase in crack size is incompatible. On top of that, under the plane strain conditions is this correction substantially smaller than under the conditions of the plane stress, by which the important effects of the local constraints are even falsified.
Clear, approaching the yield strength the inelastic part of strain becomes more significant compared to the elastic one, so that the corresponding effects, i.e. the increase in J-Integral part gets on a significance, but this is considered by the second term in the (4) formula.
Remark: Detailed derivation should be found in the literature sources given at the end of this text part!!!
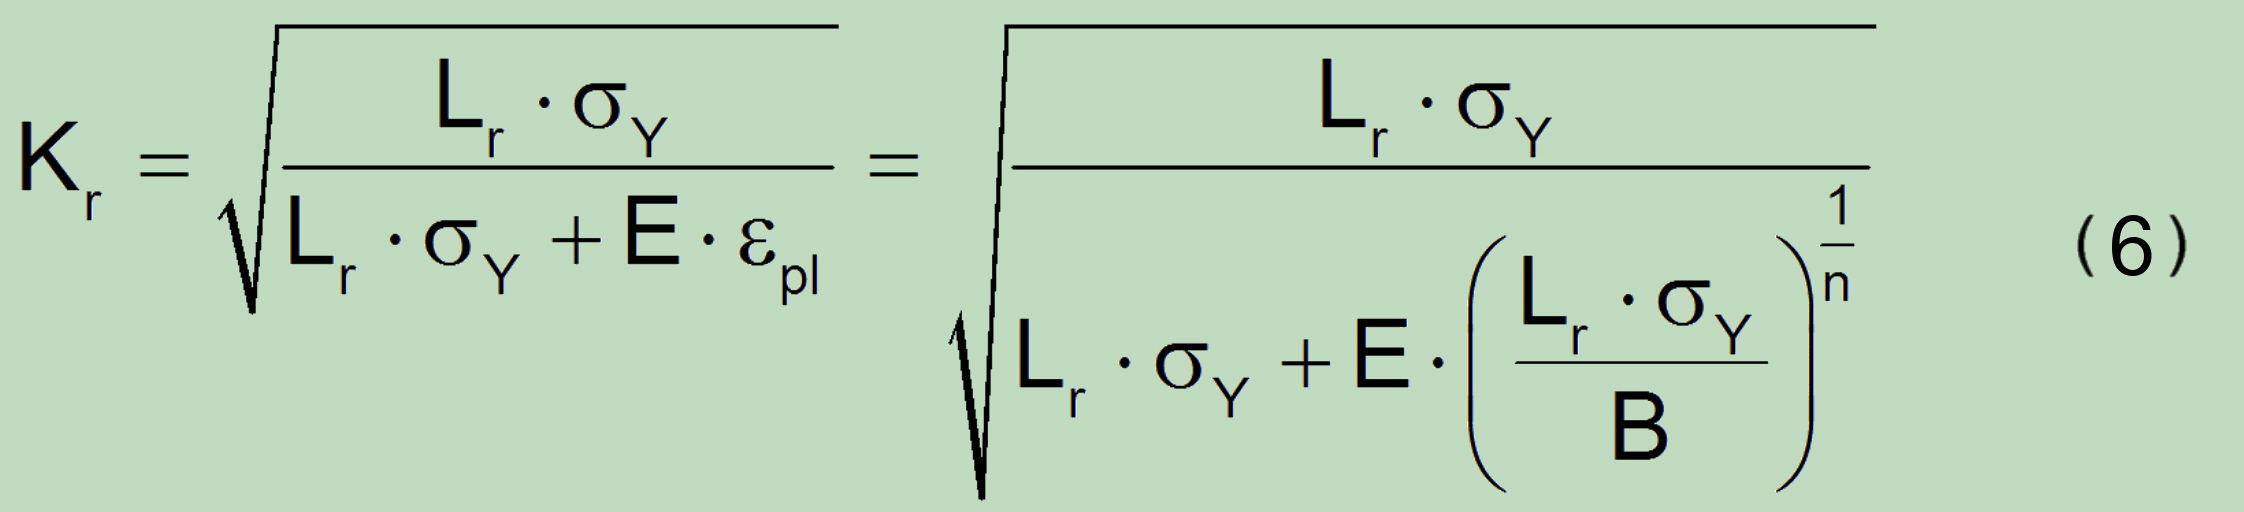
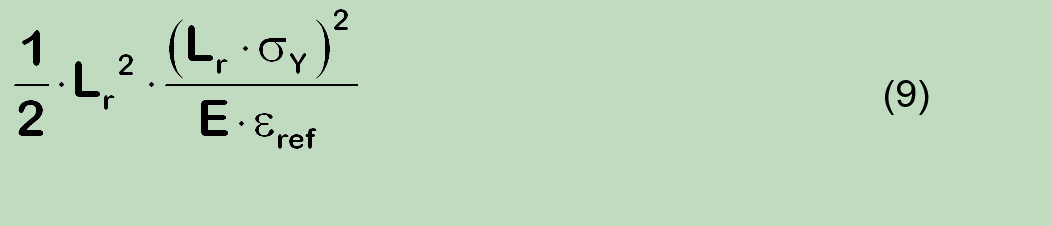
This derivation leads to the following relationship:
so that, based on the usual representation of the stable continuous stress-strain curve of the material (σ = B.εpln) according to Ramberg-Osgood, the corresponding relationship for the FAD line can be determined:
For the comparison the known R6 solution:
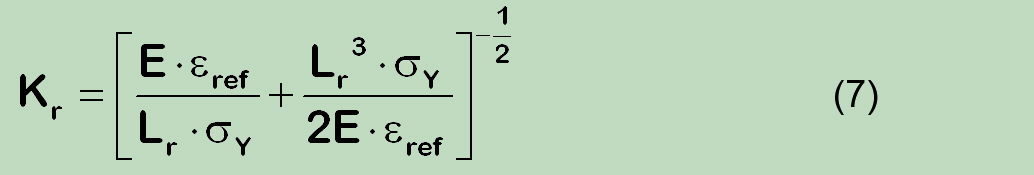
gives after rewriting to the following expression:
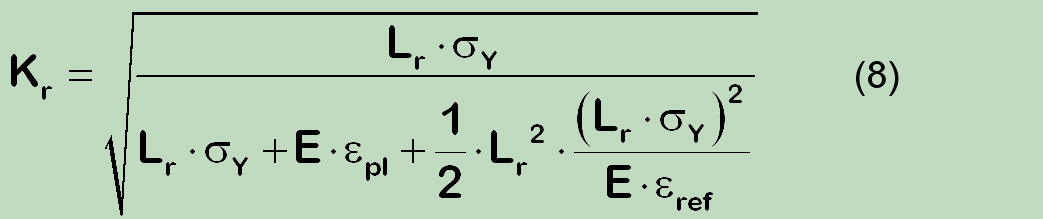
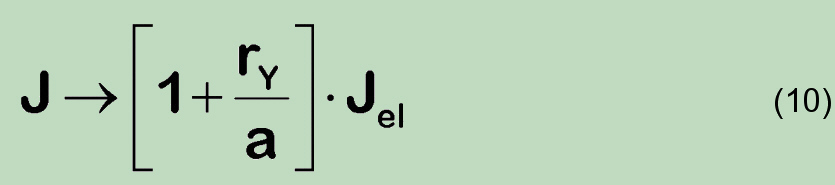
Compared to the solution (6), additional reduction factor in denominator appears:
The origin of this difference can be derived (under the consideration that if the tension in the net cross-section achieves the yield level, the first term = 1), so that follows
This indicates that this relationship is based only on the consideration of PZ correction, which even in the given form does not consider the strain hardening effects.
Moreover, the additional increase of the plastic part of the J-Integral to the design of FAD (in R-6, SINTAP, etc.) is based on inhomogeneous relationship:
As already stated (see the discussion above), the PZ correction has not the plausible theoretical background and is therefore for the application on ductile materials counterproductive. As for the rest at onset of nonlinearity of the stress-strain curve (already below yield strength) the corrector is based on the εpl in the through the crack weakened section only. At the same time, after Lr ≥ 1 the Plastic Zone equals to the total critical section and the application of this correction for the evaluation of effective crack size is senseless.
Consequently, the second argument in (7) has to be removed in the area where Lr ≥ 1 .
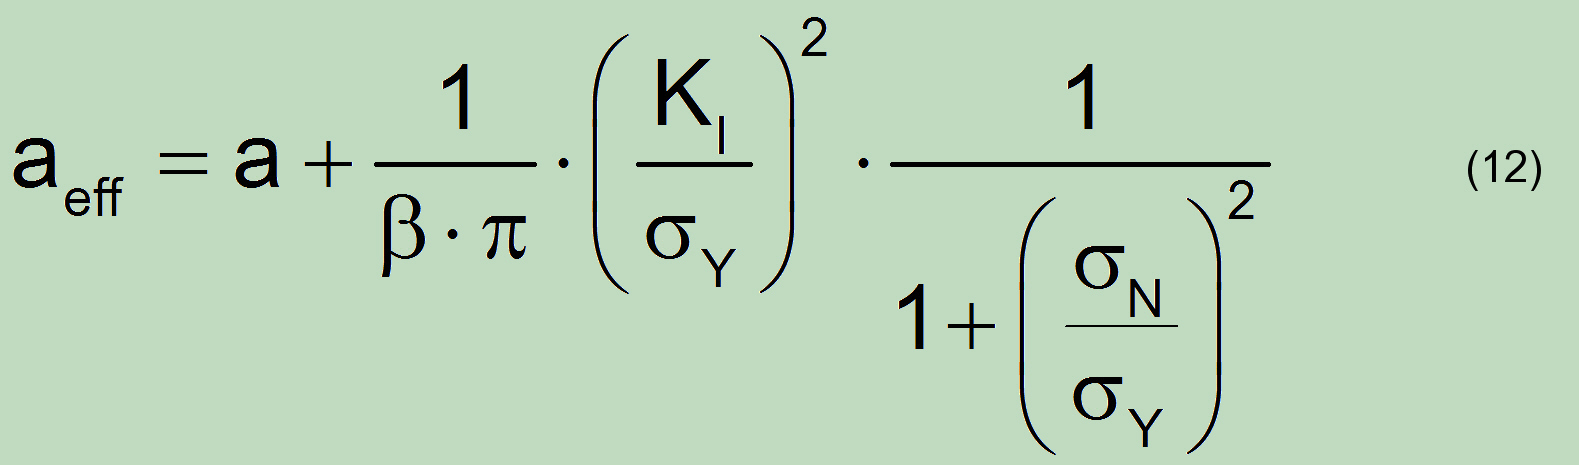
The application of (6) does not mandatory exclude the PZ correction. This can be of course taken into account in the calculation of K for the actual geometry and loads, by which the use of a more meaningful relationship (Shih, et al.), which also takes into account the strain hardening influences, is recommended:
Validation of the new Method
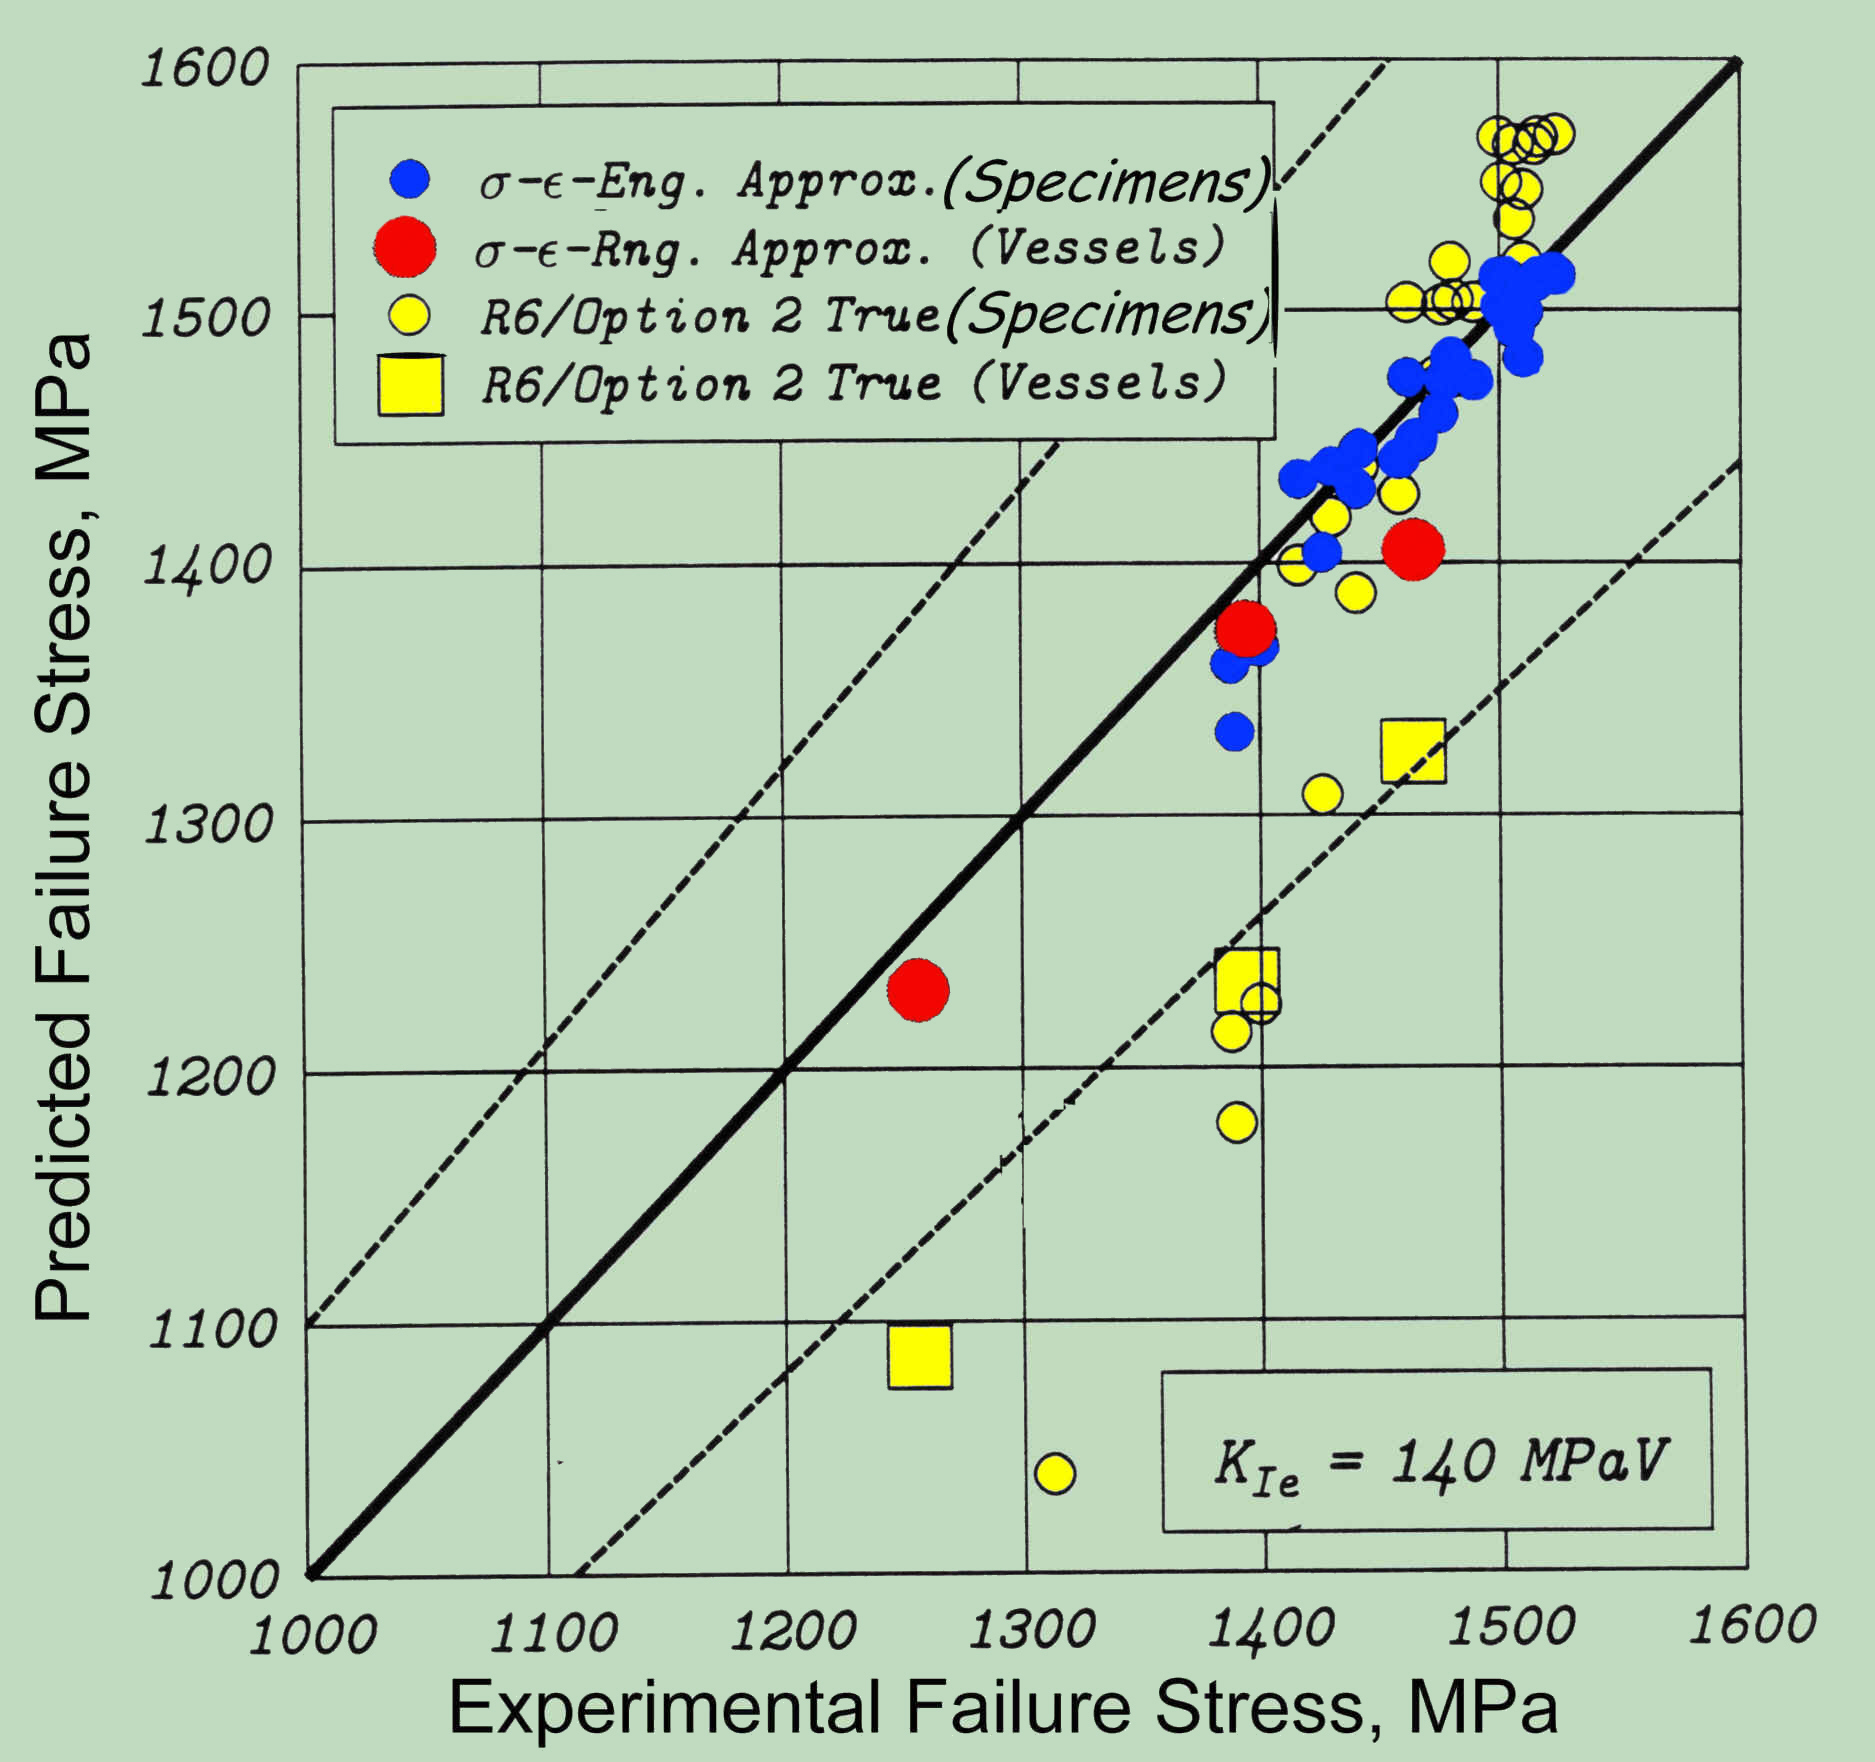
The proposed stress-strain method is verified for the application to the most critical thin-walled components with surface defects through numerous tests (carried out also on component-like specimens).
The accompanying diagram confirms the same trend as in the FAD comparison above. The agreement with the experimental results is for the proposed method perfectly. In case of R-6 Option 2, in opposite, the results indicate a systematic deviation from the experimental results, which lies in the structure of R-6/Option 2 formula of FADs and makes finally the necessity of PZ correction in (7) fully superfluous.
Increased accuracy of the here proposed method, in comparison to existing methods (R-6, FAD, etc.), both below and above the yield strength avoids the unnecessary conservatism by the design in this for the applications most important area. Interesting for numerical example (?)
and for corresponding papers (in engl.):
Development of residual strength evaluation tool based
on stress-strain approximation, in Int. Journ. of Fracture 88 (1997) pp. 129 -152 (Unfortunately subject to charge), oder
Proposal for the Improved Design of Reliable
Failure Assessment Diagrams for Components with Surface Crack, in Structural Integrity and Life Vol. 13, No2(2013)
pp. 99 - 108 (free)
Finally, one more note !
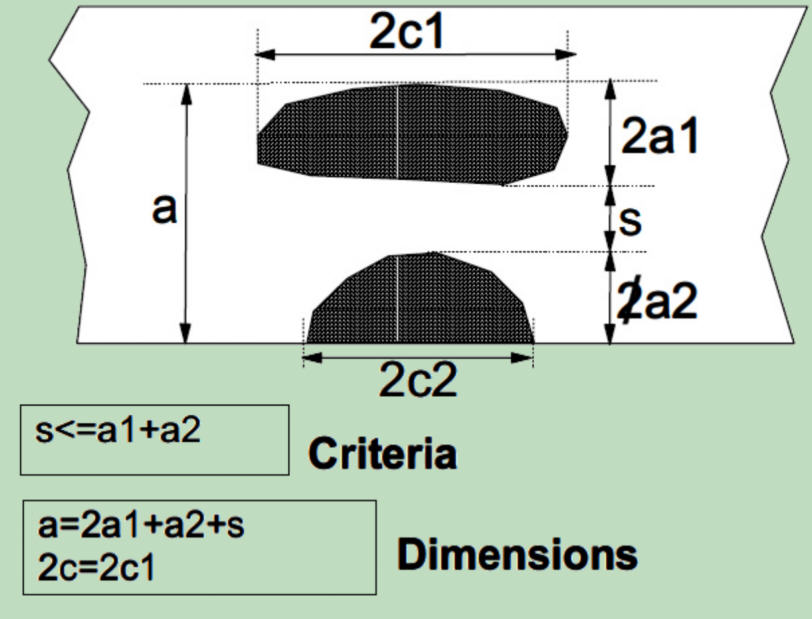
Undesirably, also in SINTAP other weaknesses of the existing criteria were taken thoughtlessly, as, for example, the treatment of crack interaction.
In none of the cases the crack closure effects of the material between the two basic cracks has been considered that naturally with the increase of s also increase. The result is, whenever s is smaller (less closure effect as well) the resulting crack will be smaller, i.e. evaluated as less dangerous. On the other hand, for the case s = a1 + a2 the resulting crack reaches its maximum size, yet though right after that (s > a1 + a2) the interaction of the two cracks will be ignored. A reasonable transition is entirely missing.
An adequate relationship may, for instance, take the following form:
Unfortunately, for a reliable proposal in this regard and at this time, accountable experimental and/or numerical investigations are missing.
Return to topReturn to main page